Smarthub Usage Explorer
SELCO’s Advanced Metering Infrastructure (AMI) meters give customers greater visibility into their electricity usage than ever before. These smart meters securely collect detailed usage data and make it available through SmartHub, helping you understand how, when, and why you use energy—so you can make informed decisions and manage your electric bill more effectively.
Access Your Usage with SmartHub
Customers can view their electricity usage using SmartHub, available both as a mobile app and on desktop.
- Mobile App: Available on all major mobile app stores
- Desktop: Visit selco.smarthub.coop
SmartHub Mobile App:
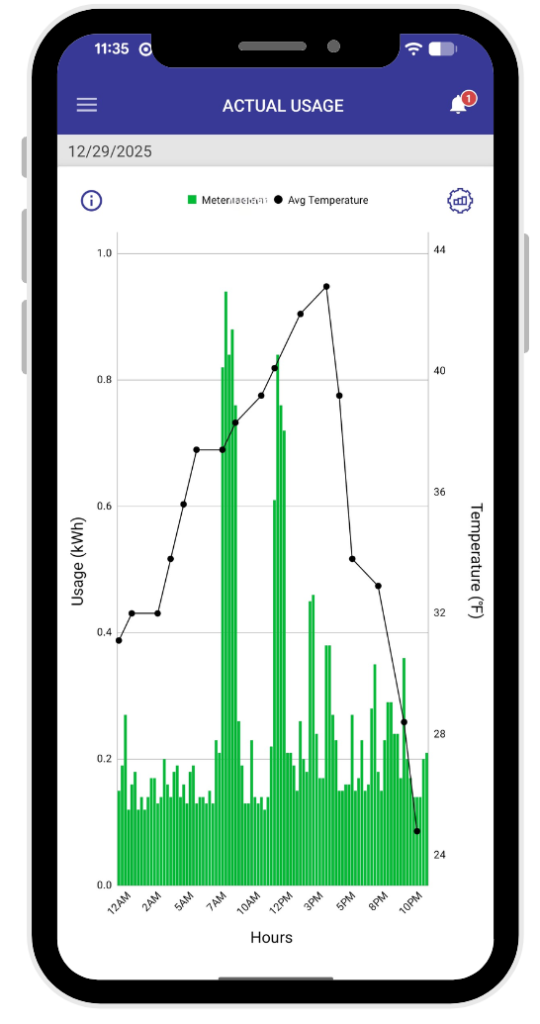
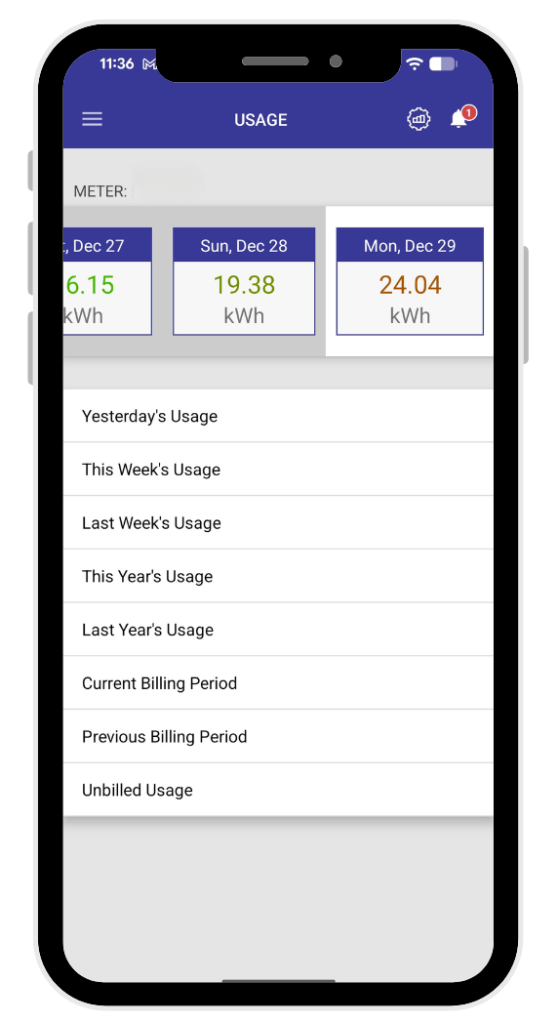
Quick Usage Snapshots
The SmartHub mobile app offers an easy, at-a-glance view of your electricity use, including:
- A snapshot of how much energy you’ve used
- Comparisons of your usage over time
- Weather and temperature data alongside your usage
By tracking your usage regularly, you can identify spikes or unusual patterns and make adjustments—such as changing thermostat settings or daily habits—to help reduce energy use.
SmartHub Desktop: Understanding your Usage
Understanding Your AMI Meter Data
You can track your electricity consumption, compare it to past billing periods, and even see what your average usage is on a particular day of the week.
- Log in to your SmartHub account
- Click on USAGE in the left sidebar
- Click on one of the following tools
- Average Usage – Shows how much electricity you typically use during a selected time period, helping you understand what “normal” usage looks like and identify opportunities to save.
- Usage Comparison – Allows you to compare two billing periods side-by-side (such as this month vs. last month or this year vs. last year) and see how weather and temperature impact your energy use.
- Usage Explorer – Provides a detailed view of your electricity usage by month, day, or hour, displayed alongside weather data so you can better understand when you’re using the most energy.
- Usage Management – Offers tools to analyze usage patterns, evaluate energy-saving changes, and download your usage data to help manage electricity use and costs.
- Usage Tracking – Provides a simple way to record and track spikes or dips in your energy use during a specific timeframe, helping you connect changes in usage to events like installing a new water heater or appliances, or adjusting A/C or furnace settings.
- Average Usage – Shows how much electricity you typically use during a selected time period, helping you understand what “normal” usage looks like and identify opportunities to save.
Some customers may notice two meters listed in SmartHub. This is normal and typically reflects the timing of when your new AMI meter was installed.
What to know:
- AMI meters are identified by a meter number that starts with a letter
- AMI meters allow you to view daily and hourly electricity usage
- With AMI Meters, usage data is available up to the previous day
The added features with AMI meters help you better understand not just how much energy you use, but when you use it.
Usage Tools on SmartHub Desktop
While the mobile app is perfect for quick check-ins, SmartHub on desktop provides more powerful tools for deeper insights.
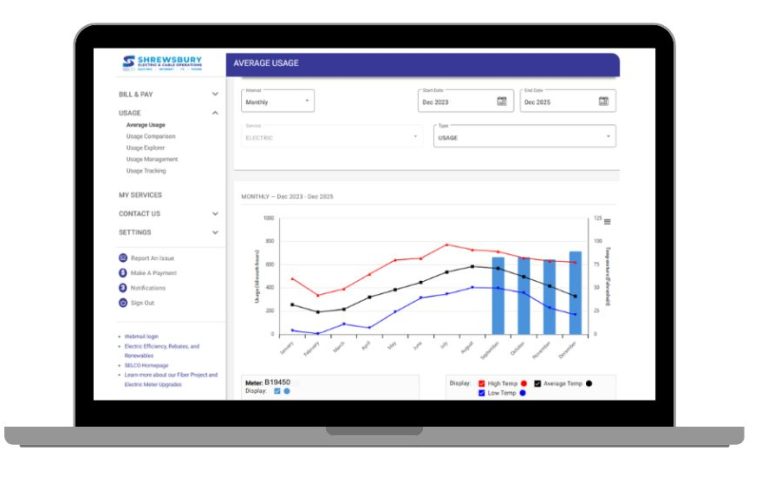
Average Usage
One of SmartHub’s most valuable features shows how much electricity you typically use during a selected time period. This helps you:
- Identify trends in your usage
- Understand what “normal” usage looks like for your household
- Spot opportunities to save money
You can use filters at the top of the page to select date ranges or specific accounts.
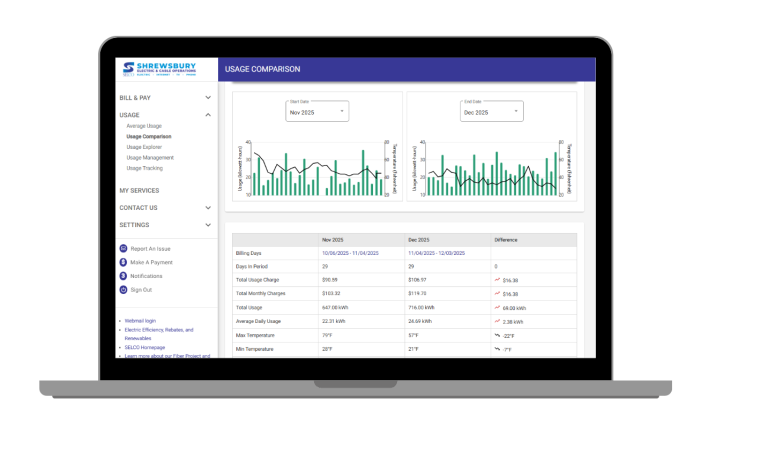
Usage Comparison
The Usage Comparison tool lets you view two billing periods side-by-side, such as:
- This year vs. last year
- This month vs. last month
You can also see how weather and temperature impacted your bill, making it easier to tell whether new habits, appliances, or efficiency upgrades are making a difference.

Usage Explorer
When you use electricity can be just as important as how much you use. The Usage Explorer gives you a detailed view of your energy usage all in one place.
Features include:
- Views by month, day, or hour
- Usage displayed alongside weather and temperature trends
- Filters for date ranges
You’ll also see:
- A breakdown of monthly, daily, and hourly costs
- Temperature data overlaid on usage graphs
Visual reports showing usage patterns with average temperatures for the selected time frame

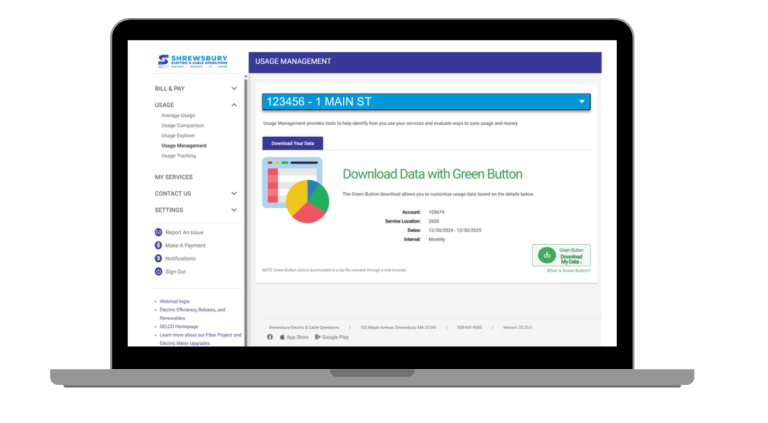
Usage Management Tools
SmartHub’s Usage Management tools help you better understand how you use electricity and identify ways to save energy and money.
By downloading your energy usage data and using a usage tracker, you can:
- Analyze usage patterns
- Evaluate the impact of energy-saving changes
Green Button Download
The Green Button feature lets you download your usage data so you can customize and analyze it based on your needs.
Usage Tracking
Usage Tracking allows you to log events that may impact your electricity use, helping you connect changes in usage to real-life activities.
Examples of events to track include:
- Installing new appliances
- Changes to heating or cooling settings
- A new water heater or HVAC system
Tracking these events over time makes it easier to understand spikes or dips in usage.
Knowledge Is Power
SELCO’s AMI meters, paired with SmartHub, put valuable energy information directly in your hands. With better visibility into your electricity use, you can make informed choices, build energy-smart habits, and take greater control of your electric bill.